Capitalizing on the Early Education Real Estate Boom: Why Indianapolis Investors Should Act Now in 2025–2033
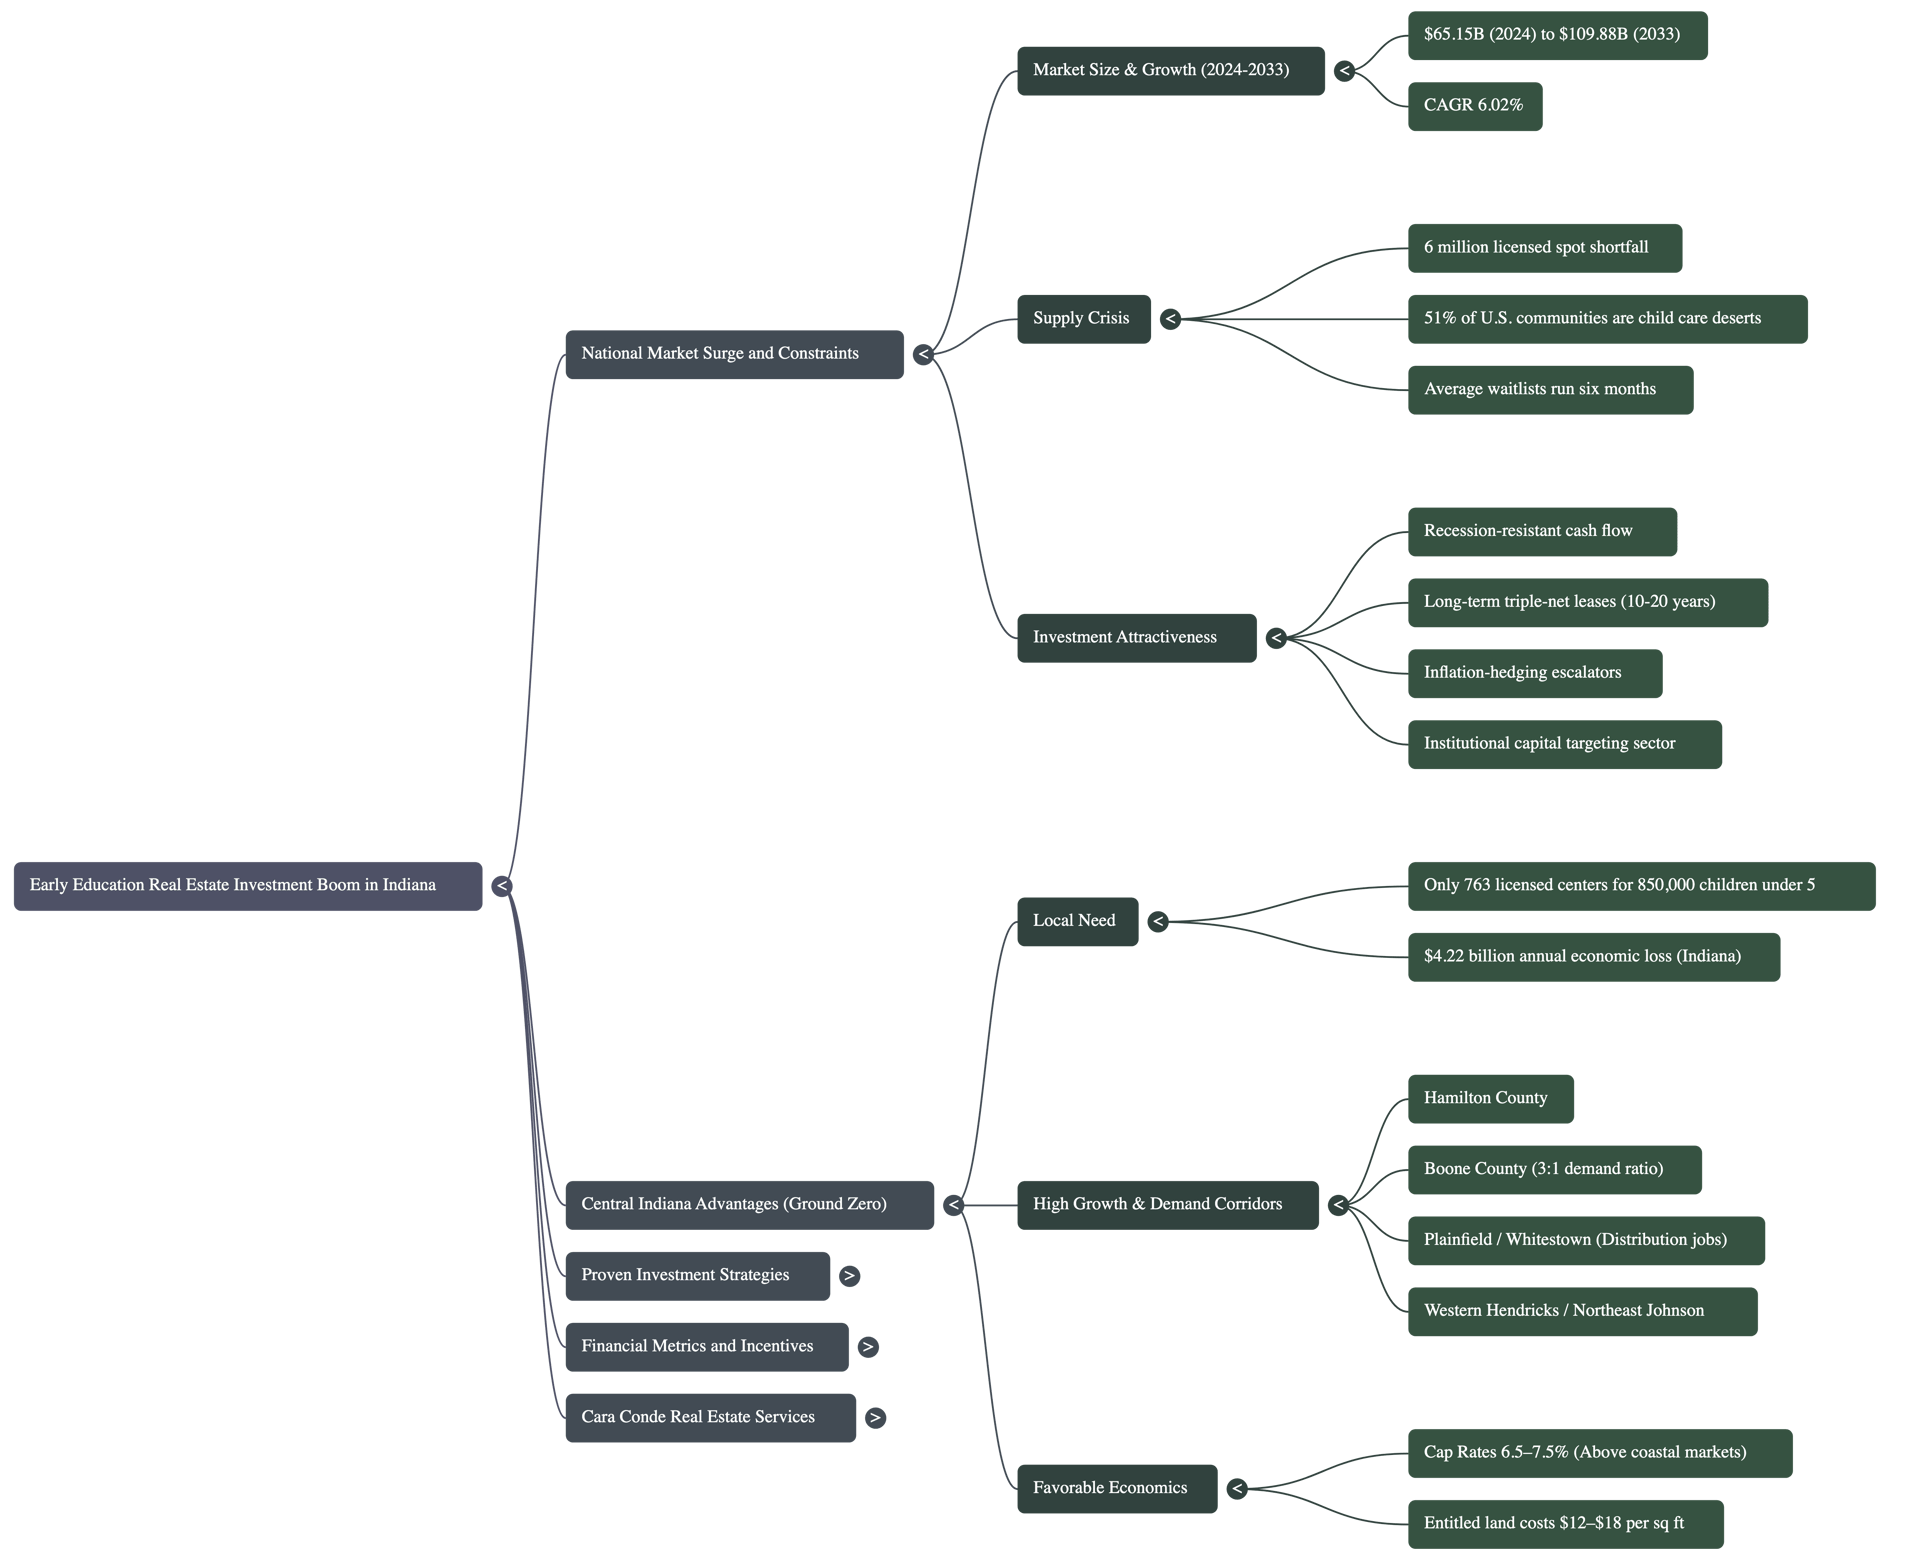
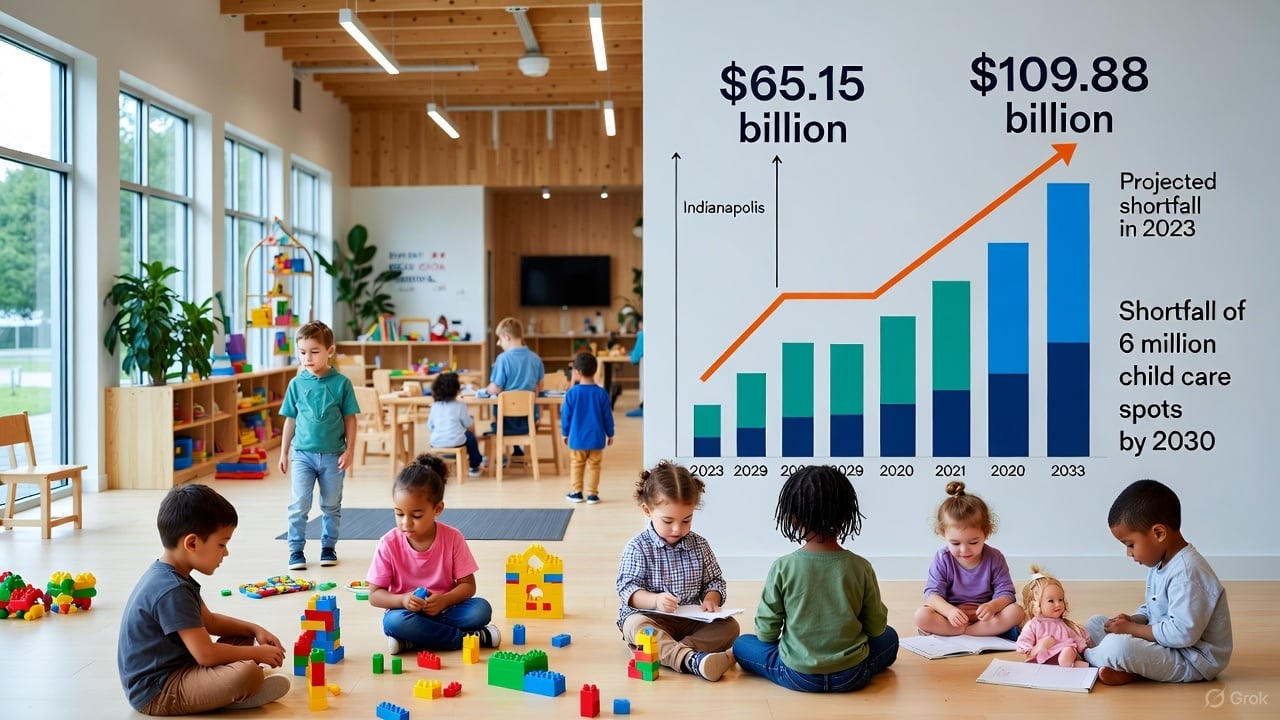
The U.S. child care market is surging from $65.15 billion today to $109.88 billion by 2033 — while facing a 6 million licensed spot shortfall. Indianapolis sits at the epicenter of demand, cost advantage, and institutional capital inflow.
Table of Contents
- The National Surge: A Perfect Storm of Demand and Supply Constraints
- Why Indianapolis & Central Indiana Are Ground Zero for This Boom
- Four Proven Investment Strategies That Are Working Right Now
- How to Measure Real Returns: Why IRR Is the Only Metric That Matters
- YouTube Walk-Through: Inside a $6.2M Indianapolis-Area Child Care Investment
- Deep-Dive Podcast: The Child Care Real Estate Playbook (42-min)
- People Also Ask – Cara Conde Answers Your Top Questions
- Take Action Before Indiana Caps Compress – Contact Cara Today
The numbers behind the U.S. child care crisis are impossible to ignore — and they’re creating one of the strongest commercial real estate investment themes of the decade.
As of 2024, the national child care market stands at $65.15 billion, projected to surge to $109.88 billion by 2033 (CAGR 6.02%). Yet with 14.7 million children under age 6 needing care and only 8.7 million licensed spots available, we face a gaping 6 million-spot shortfall. Over 51% of U.S. communities qualify as “child care deserts,” where demand outstrips supply by at least 3:1. Average waitlists run six months — 13% of families wait a full year or longer.
In Indiana specifically, the shortage is acute: only 763 licensed centers serve a population of 850,000 children under 5, and the state meets less than two-thirds of total need. The annual economic loss from inadequate child care in Indiana? $4.22 billion in lost productivity, wages, and tax revenue.
Big money has taken notice. Institutional funds, family offices, and REITs are aggressively targeting early education properties for their recession-resistant cash flow, long-term triple-net leases (10–20 years), corporate guarantees, and inflation-hedging escalators. As CNBC declared on December 3, 2025: this sector has evolved from fragmented local operators into “essential infrastructure” with double-digit margins and bond-like stability.
1. The National Surge: A Perfect Storm of Demand and Supply Constraints
Return-to-office mandates have driven maternal workforce participation to 76% for mothers with children under 6. Federal programs (CCDBG, stabilization grants) continue pouring billions into operators. Meanwhile, post-pandemic suburban migration has widened child care deserts — especially in fast-growing exurban counties.
| Metric | 2024 Value | 2033 Projection | CAGR / Notes |
|---|---|---|---|
| U.S. Child Care Market Size | $65.15B | $109.88B | 6.02% |
| Children Under 6 Needing Care | 14.7M | Stable to slight growth | — |
| Available Licensed Spots | 8.7M | — | — |
| National Shortfall | ~6 million | Persistent or widening | — |
| Child Care Deserts | 51% of U.S. communities | Expanding in suburbs | — |
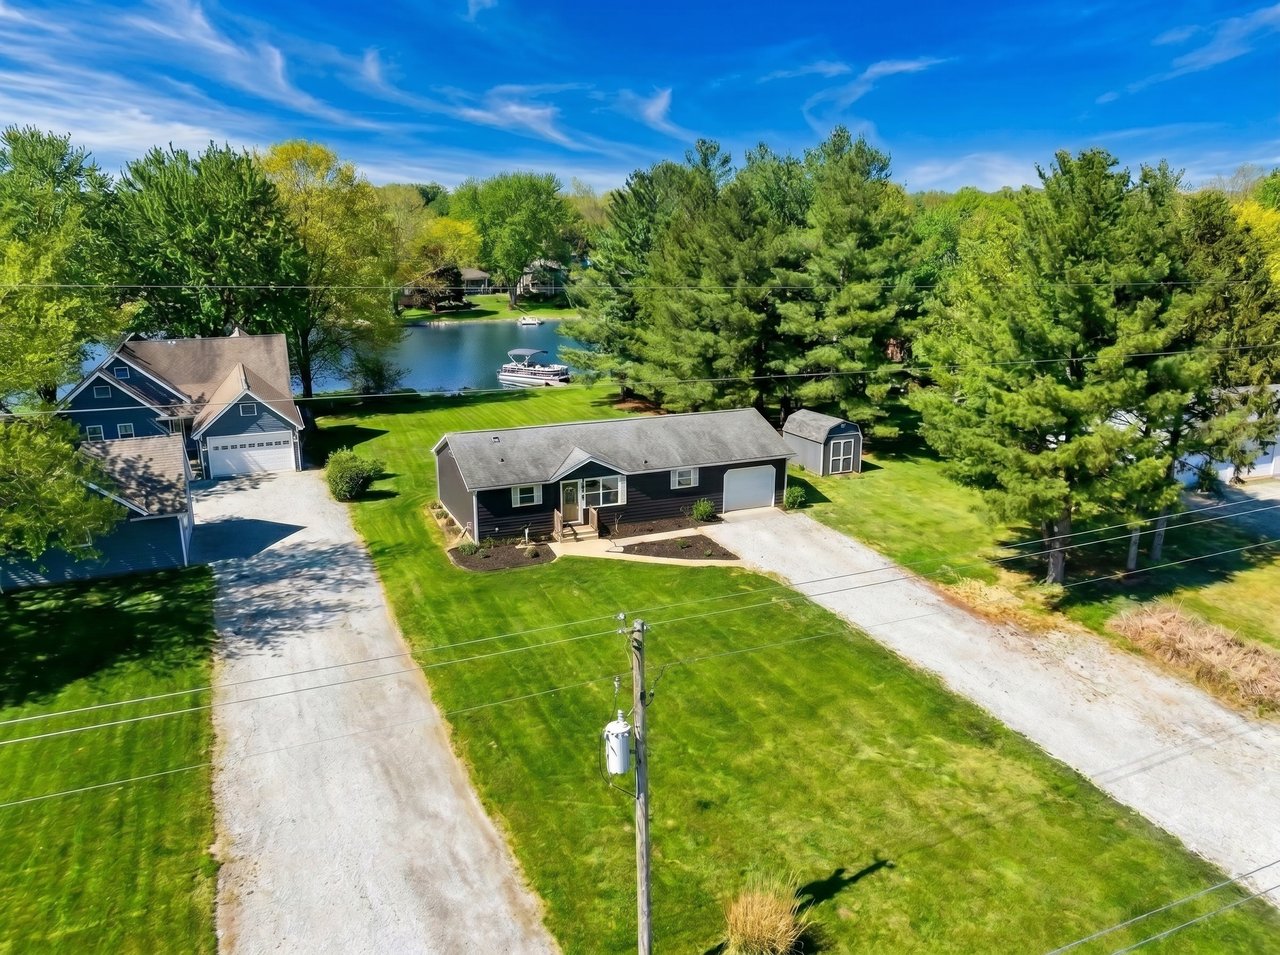
2. Why Indianapolis & Central Indiana Are Ground Zero for This Boom
As I detailed earlier this year in Why Indiana Is the Next Hotspot for Commercial Real Estate Development in 2025, the exact same growth corridors exploding with logistics and life-science jobs are the ones most starved for quality child care.
- Hamilton County added approximately 4,000 children under age 5 since 2020
- Plainfield and Whitestown welcomed over 40 new distribution centers since 2021 — bringing tens of thousands of new families
- Western Hendricks, northeast Johnson, and all of Boone County show demand-to-supply ratios exceeding 3:1
- Entitled land in growth corridors still trades at $12–$18 per sq ft (vs. $50+ in comparable Sun Belt metros)
- Triple-net child care cap rates remain 6.5–7.5% — 100–200 basis points above coastal markets
3. Four Proven Investment Strategies That Are Working Right Now
- Triple-Net Leases with National/Regional Operators
KinderCare, Bright Horizons, Primrose, Goddard, Lightbridge — 10–20-year terms with corporate guarantees and 2–3% annual escalators. - Sale-Leasebacks with Established Local Owners
Successful operators unlock decades of equity while staying in place — delivering some of the cleanest leases in commercial real estate. - Adaptive Reuse of Vacant Retail & Office
25,000–40,000 sq ft big-box or second-generation office along I-465, I-69, and I-70 can become licensed 250–400-child campuses in 12–18 months, often with TIF incentives. - Ground-Up Development in Proven Corridors
Whitestown, Lebanon, Bargersville, and Greenwood still have entitled sites that pencil at strong 11–15% IRR over a 10-year hold.
4. How to Measure Real Returns: Why IRR Is the Only Metric That Matters
The real power shows up in IRR, not just cap rate.
A seemingly modest 7-cap with 3% annual escalators over 15 years routinely delivers mid-teens IRR. I published a complete step-by-step guide with free downloadable Excel templates that many of my investors now use as their standard model:
→ In-Depth Guide to Internal Rate of Return (IRR) – Free Templates Included
5. YouTube Walk-Through: Inside a $6.2M Indianapolis-Area Child Care Investment
6. Deep-Dive Podcast: The Child Care Real Estate Playbook (42-min)
Cara sits down with a $400M family office principal to break down underwriting, site selection, and why Indiana is crushing national returns right now.
7. People Also Ask – Cara Conde Answers Your Top Questions
Is early education real estate truly recession-resistant?
Yes — child care is one of the last expenses parents cut. Enrollment actually grew through both the 2008 financial crisis and the 2020 pandemic. Triple-net structures shift nearly all operating risk to the tenant, delivering bond-like stability with equity upside.
How do I pinpoint the real child care deserts around Indianapolis?
We use proprietary GIS overlays of children-under-5 population against licensed capacity. Ratios above 3:1 light up instantly. Right now the hottest pockets are western Hendricks County, northeast Johnson County, and the entire Boone County growth corridor.
What government incentives and grants are available in Indiana?
The Employer Child Care Expenditure Credit reimburses up to 50% of setup costs (extended through July 2027), plus IEDC economic development grants, TIF districts in most growth counties, and ongoing federal CCDBG matching funds. These layers routinely add 1–2 points to levered IRR.
How does IRR change the way I should evaluate these deals?
Cap rate is a snapshot; IRR tells the full movie. A 7-cap deal with 3% annual bumps over 15 years can deliver 13–16% IRR. My free guide with Excel templates walks you through exactly how to model Indiana-specific yields.
I’m primarily a residential investor — can I make the jump to commercial child care?
Absolutely, and it’s one of the smoothest transitions in real estate. You already understand location, demographics, and long-term appreciation — now you simply add predictable, passive, triple-net cash flow.
The Window Is Wide Open — But Closing Fast
Q3 2025 saw early education property listings rise 14% nationally, yet cap rates only moved 10 basis points. Institutional funds are raising nine-figure pools targeting this exact asset class. When Indiana caps compress another 100 basis points, the best opportunities will be gone.
Cara Conde
SVN | Northern Commercial
(317) 999-9888 (call or text)
[email protected]
caraconde.com
Check my Google Business Profile & recent client reviews
Why Indiana Is the Next Hotspot (2025 Update) • Free IRR Guide + Excel Templates
Let’s turn the national child care crisis into your portfolio’s strongest performing asset class.
Contact me 7 days a week — I’m ready when you are.